

Vistumbler
About Vistumbler
Wireless problems are invisible, which is why people guess at them. A connection drops in one room, slows in the evening, or refuses to reach the far end of a house, and the usual response is moving the router and hoping. Vistumbler replaces the guessing by showing what is actually in the air around you.
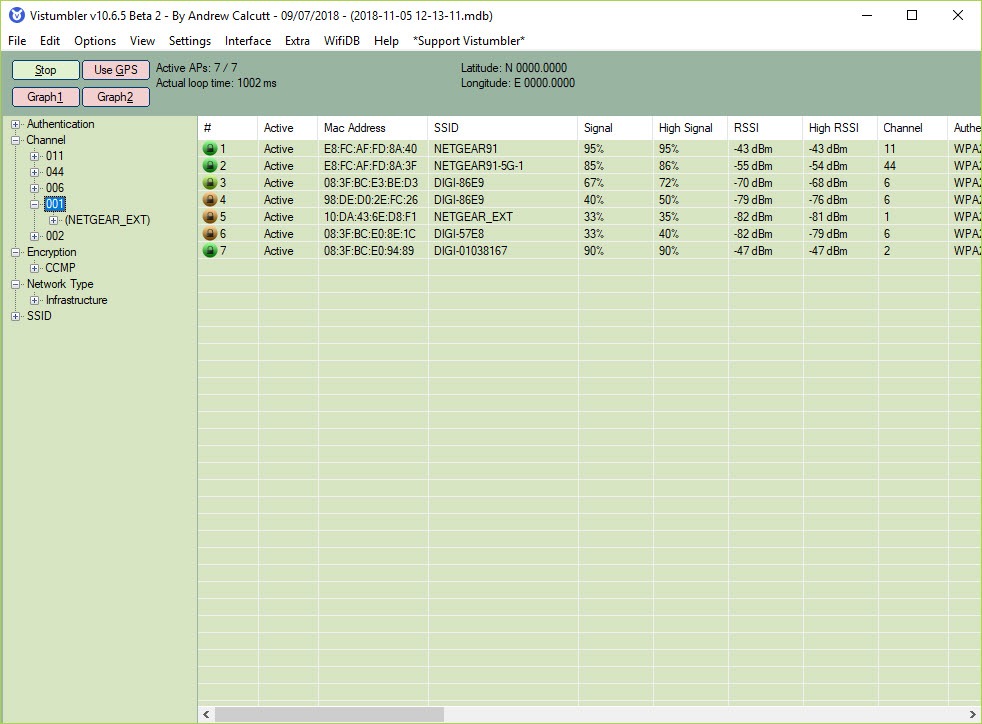
Vistumbler lists every access point within reach with its name, hardware address, signal strength, the channel it occupies, plus the type of protection it uses. Those five facts explain the overwhelming majority of wireless complaints.
What it does not do matters as much. This receives the information access points broadcast continuously so that devices can find them, and it does nothing else. It does not connect, does not capture traffic and does not attempt anything against a network. It listens to announcements that are public by design.
The channel graph solves most problems
Of everything in Vistumbler, one view answers the common question, and it is the graph showing which channels are occupied and how strongly.
Wireless bands hold a limited number of channels, and neighbouring networks sharing one interfere with each other. In a block of flats or a terraced street, a dozen networks crowded onto the same channel is normal, and every one of them performs worse for it.
Reading that graph tells you which channel is least contested, and moving your own network there is frequently the entire fix for a connection that slows in the evening when everybody comes home. That single change resolves more complaints than any amount of new hardware.
inSSIDer presents the same information with a friendlier interface and is the easier starting point for somebody who only wants the channel answer.
Signal strength, and walking the building
Vistumbler draws live signal graphs per access point, which turns a survey into something you do by walking around.
Carry the machine to the far bedroom and watch the number fall, and you have measured coverage rather than guessed at it. Do the same with the router in a different position and you can compare two placements with evidence.
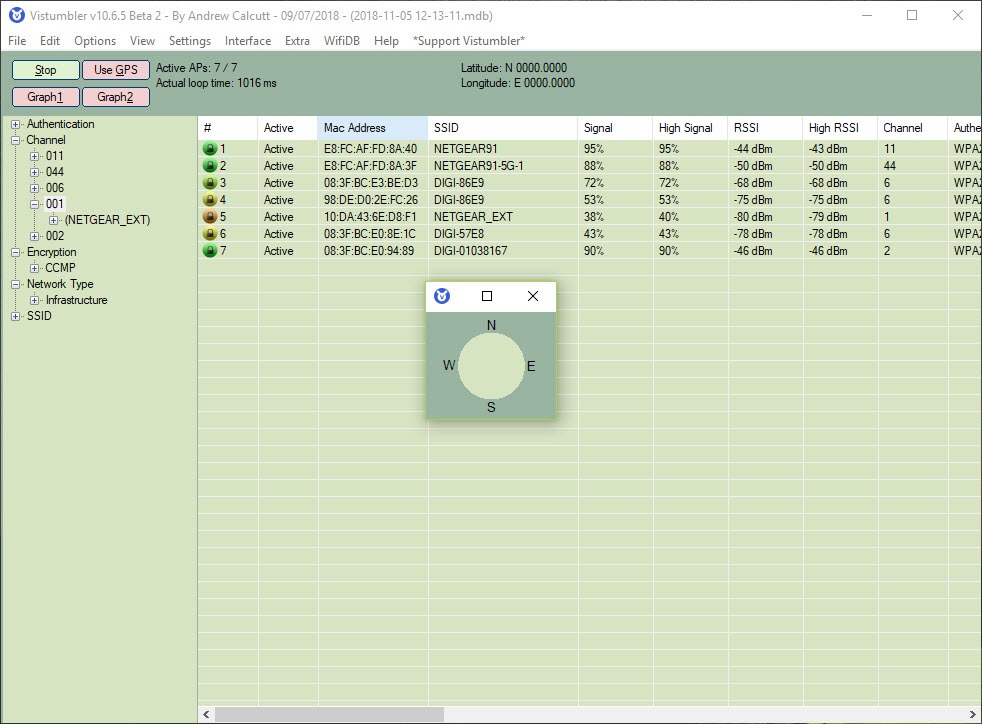
Vistumbler also speaks the signal strength aloud, which sounds eccentric and is the feature that makes a walking survey practical. Watching a screen while navigating a building is awkward, and hearing the strength called out leaves you free to look where you are going.
GPS, and mapping coverage
Position data can be recorded alongside each detection, pairing every access point with where it was seen.
The practical use is coverage mapping. A site with several access points, a campus, a warehouse or a large property can be walked or driven while logging, and the result exported for mapping shows where coverage exists and where it does not.
Exports go to mapping formats along with plain data files, so the survey becomes a map or a spreadsheet rather than staying inside the program.
Logging other people’s access points is possible, and the honest position is that they broadcast their presence publicly and the tool records nothing beyond that announcement.
Reading the protection column
The protection type Vistumbler reports is diagnostic information about your own equipment first.
A network still using an outdated protection standard deserves attention, because the difference between the older schemes and current ones is substantial rather than incremental. Finding your own network in that category is the cue to change a setting.
For monitoring which devices are actually connected to your network rather than which networks exist, Wireless Network Watcher answers that instead and alerts when something new appears.
Conclusion
Vistumbler turns an invisible problem into a readable one. The channel graph alone justifies the download, because a congested channel is the single most common cause of a wireless connection that works badly at exactly the times you want it, and the fix is one setting once you can see the contention.
Add the walking survey with spoken signal strength and the position logging, and it becomes a proper survey instrument for anybody positioning access points across a building or a site. It is passive throughout, it reads what is already being broadcast, and the interface expects you to know what the columns mean, which is a fair trade for the detail it gives you.
Pros & Cons
- Lists every access point in range with channel, strength and protection type
- Channel graph shows contention directly, which resolves most speed complaints
- Live signal graphs make a walking coverage survey practical
- Spoken signal strength leaves you free to look where you are walking
- Position logging pairs detections with locations for coverage mapping
- Exports to mapping formats and plain data files
- Passive throughout, receiving broadcast information and nothing else
- The interface is utilitarian and assumes you know what the columns mean
- Position logging needs a receiver attached, which most machines lack
- Reports what networks exist rather than what is happening on yours
- Friendlier tools answer the common channel question with less to read
Frequently asked questions
The information access points broadcast so devices can find them, meaning the network name, hardware address, signal strength, channel, protection type. It receives those announcements and does nothing further.
Through the channel graph. Neighbouring networks sharing a channel interfere with each other, and moving your own network to a less contested channel frequently fixes a connection that degrades when the area gets busy.
Because a coverage survey involves walking around a building, and watching a screen while doing that is awkward. Hearing the strength called out lets you concentrate on where you are going.
No. It is entirely passive, receiving the announcements access points send continuously. Connecting, capturing and anything resembling an attack are all outside what it does.


