System Information Viewer

 (207 votes, average: 4.25 out of 5)
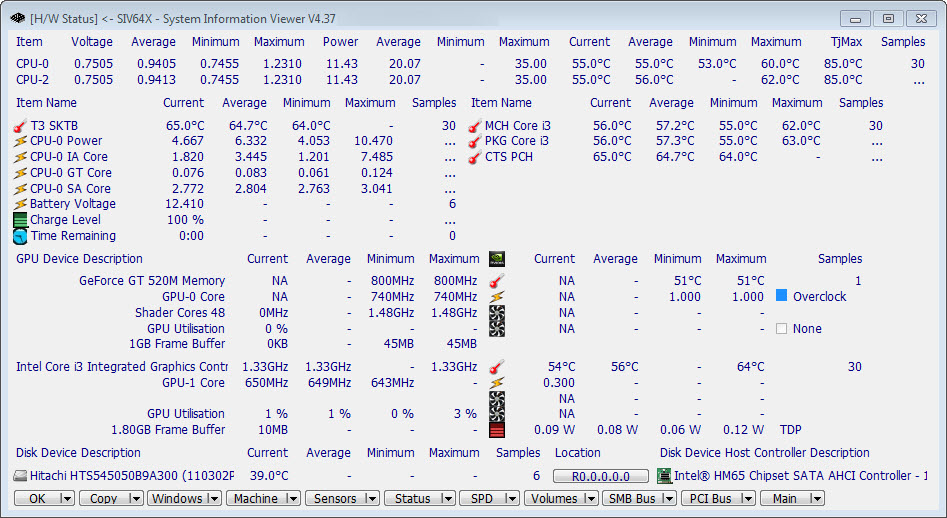
About System Information Viewer
System Information Viewer (commonly abbreviated SIV) is one of the deepest hardware and system inspection tools available for the PC, packing a level of detail into its read-outs that most competing utilities only approach piecemeal.
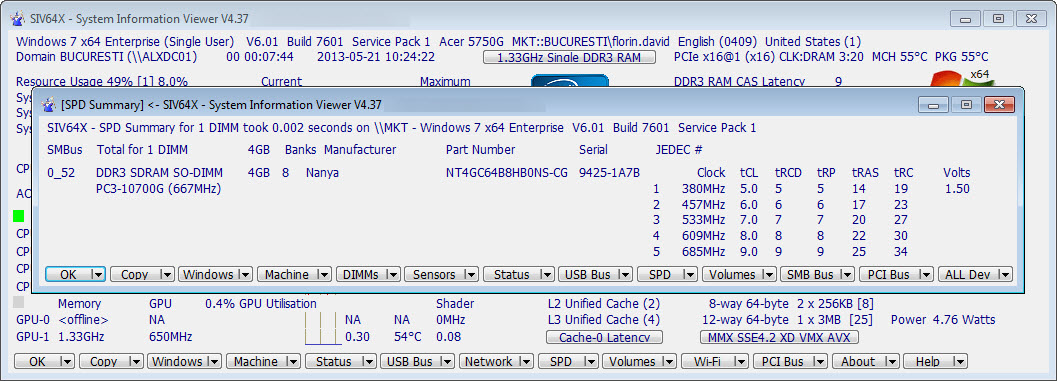
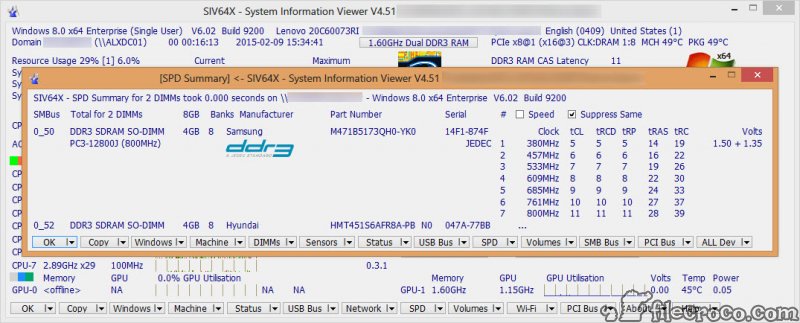
Launch the application and you get an immediate snapshot of every meaningful component in the machine, from CPU details and individual core voltages to RAM module SPD data, motherboard sensors, SMBus devices, PCI configuration, ACPI tables, storage SMART attributes, and dozens of additional categories that each have their own panel of dense, accurate readings.
The tool runs as a single portable executable with no installation, no registry entries, and no telemetry of any kind. The whole application lives in one folder you can drop on a USB stick and carry between machines.
For diagnostic work where you need real information about hardware you’ve never seen before, this is the kind of utility that earns a permanent place on the technician’s toolkit.
What you actually see when you launch it
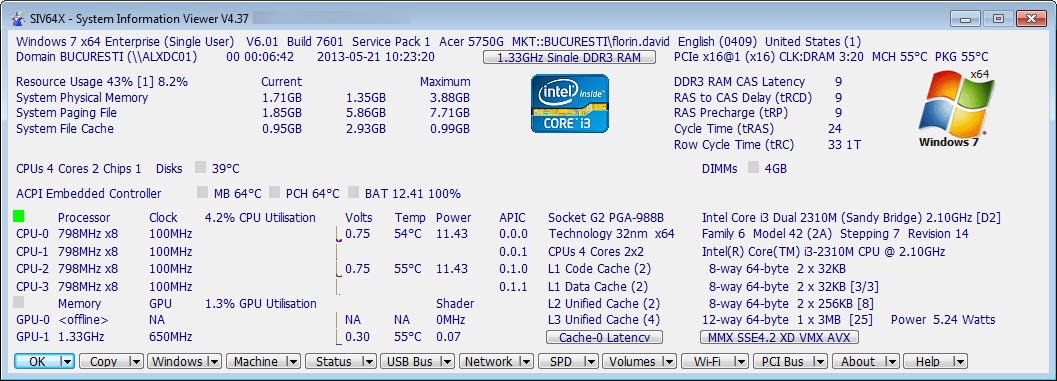
The main window is a dense, information-rich panel that organizes data by category across a navigation tree on the left. CPU, Memory, Motherboard, Sensors, Disks, Network, Video, Audio, USB Devices, PCI Devices, SMBus, Power, and many more categories each open into detailed sub-panels with every relevant reading the hardware reports.
The CPU panel alone shows brand, model, stepping, microcode revision, core count, thread count, current frequency per core, voltage rails, cache topology, supported instruction sets, and TDP information. Click into the topology view and you see how the cores map to physical packages, NUMA nodes, and cache levels.
This kind of depth (showing not just what the CPU is but how it’s structured internally) is what makes System Information Viewer the tool serious users reach for.
The motherboard panel reads BIOS version and date, chipset details, exact slot configurations, every SMBus device the chipset can see, sensor readings for temperatures and voltages from any compatible monitoring chip, and the firmware-reported memory slot population with module-by-module SPD data. For overclockers, system builders, and anyone investigating a stability problem, having all of this in one place removes the need to bounce between separate utilities.
Sensor coverage that goes deeper than most
This is one of the areas where System Information Viewer sets itself apart. The sensor reading panel pulls data from a wider range of monitoring chips than most competing utilities recognize, including obscure or older Super I/O chips, custom monitoring solutions on motherboards, and the various sensor hubs that modern CPUs and GPUs expose.
For a typical desktop the sensor panel shows CPU package temperature, individual core temperatures, motherboard temperature, chipset temperature where available, voltage rails (CPU Vcore, memory voltage, +3.3V, +5V, +12V, individual VRM outputs on some boards), fan speeds for every connected fan with per-fan control where the motherboard exposes it, and additional sensors specific to the board manufacturer.
For laptops, battery sensor data includes design capacity, current full-charge capacity, charge cycles, battery temperature, individual cell voltages where reported, and power consumption rates.
This is the kind of detail that helps you figure out whether a laptop’s deteriorating runtime is the battery aging out or something else draining it.
Hardware identification that gets things right
When working on unfamiliar hardware, the first question is usually “what exactly is this machine made of.” System Information Viewer answers that question more thoroughly than most.
The disk panel identifies every storage device by exact model number, firmware version, serial number, and interface speed. NVMe drives report their controller, namespace configuration, and SMART data including media wear indicators, power-on hours, and the detailed counters that predict drive failure before it happens.
The network panel identifies every adapter by exact chipset (not just “Realtek Gigabit Ethernet” but the specific RTL8111 variant, for instance), driver version, link state, negotiated speed, full-duplex status, and current bandwidth utilization. For wireless adapters, the signal strength and connected access point details are included.
USB devices show the full enumeration tree with every connected device’s vendor and product IDs, descriptor strings, supported endpoints, and current power state. PCI and PCIe devices show similar detail including link speed, lane count, and current power state. ACPI tables can be inspected directly, which matters for low-level work where the firmware’s ACPI configuration affects how the operating system sees the hardware.
Battery and power detail for portable systems
For laptops and other battery-powered systems, the power panel is one of the strongest features. Beyond the basic charge percentage that any operating system shows, System Information Viewer displays per-cell voltage where the battery management system reports it, charge and discharge rates in real time, accumulated charge cycles, the difference between original design capacity and current actual capacity, and historical wear estimates.
For laptops that have been in service for several years, this information is what tells you whether the battery is worth replacing or whether the machine is otherwise still healthy. Charge cycle counts in the hundreds with significant capacity loss say one thing. Low cycle counts with intact capacity say another, and the diagnostic path is clear from the readings.
For users who specifically want battery information without the broader system view, Battery Monitor covers just that subset. The advantage of System Information Viewer is having battery details alongside everything else in one consolidated view, which matters when you’re investigating a problem that could involve multiple subsystems.
Read-only by design
The application reports information without writing changes to the system. Nothing is modified, nothing is reset, no configuration is altered. This is appropriate for the diagnostic role the tool fills. When you’re trying to figure out what’s going on with hardware that’s behaving oddly, the last thing you want is a utility that changes things while it’s gathering data.
The read-only design also means System Information Viewer is safe to run on production systems, servers, and machines you’re documenting before a recovery or migration job. It gathers comprehensive information for reporting and reference without any risk of altering the system state.
For inventory work across many machines, the application can be run in command-line mode with output redirected to a file, producing a complete hardware inventory in a format you can archive or compare across systems later.
Reporting and export
For documentation, support tickets, or hardware audits, the application can save its complete read-out to a text file with one click. The exported report includes everything the live view shows, structured in a readable format. Email it, paste it into a support ticket, or archive it as a baseline for comparison.
The command-line mode adds scriptability for environments where you want to run the tool across many machines and collect the results centrally. A scheduled task running the application with output redirected to a network share gives you a regularly-updated inventory of hardware details across a fleet of machines.
For IT departments that need to know exactly what hardware is in service without buying a dedicated asset management product, this kind of automation is genuinely useful.
Active development and current hardware support
The application receives regular updates that add support for new CPU generations, new chipsets, new sensor chips, and new hardware as it appears in the market. Recent AMD and Intel CPU families are fully recognized with their specific cache topologies and instruction set extensions. Modern NVMe drives, PCIe 5.0 devices, DDR5 memory with its updated SPD format, and current generation network controllers all show their full detail.
This active maintenance is part of what keeps System Information Viewer at the top of the diagnostic-tool category. Hardware changes constantly, and a system information utility that hasn’t been updated for current generations of chips will show truncated or incorrect information on modern machines.
The ongoing updates here mean the tool remains as useful on a brand-new build as it is on a decade-old machine in the back of an office somewhere.
Conclusion
System Information Viewer is the right tool for anyone who needs accurate, detailed information about the hardware in a machine, whether that’s a system you’re building, a laptop you’re diagnosing, a server you’re documenting, or unfamiliar equipment you’re trying to understand.
The depth of recognized sensors, the precision of the reported specifications, the read-only safety, and the portable executable all add up to a utility that earns a permanent spot in the toolkit. The reporting and command-line features extend its usefulness from individual machines into fleet-level documentation and ongoing inventory work.
For technicians, system administrators, overclockers, hardware enthusiasts, and anyone who works with unfamiliar PCs regularly, this is one of those installs you do once and never reconsider. The application is consistent, accurate, actively maintained, and stays out of your way while delivering exactly the information you need.
The combination of breadth, depth, and portability is what makes it stand out among system information utilities, and the ongoing updates mean it remains as useful on current hardware as it is on machines from a decade ago.
Pros & Cons
- Extreme depth of information across CPU, memory, motherboard, sensors, storage, network, and many other categories
- Recognizes a wide range of sensor chips including obscure ones other utilities miss
- Detailed battery diagnostics with per-cell voltage and accurate wear estimates
- Single portable executable with no installation or registry footprint
- Read-only design is safe to run on any system without altering configuration
- Comprehensive report export for support tickets, audits, and documentation
- Command-line mode supports automation across multiple machines
- Active development with regular updates for current hardware
- Free for personal use
- Information density takes some learning to navigate efficiently for first-time users
- Some low-level features require running with elevated privileges
- The interface is functional rather than visually polished
Frequently asked questions
The application displays detailed information about every major hardware component including CPU specifications and live frequency, memory module details with SPD data, motherboard sensors, storage drives with SMART data, network adapters, video and audio hardware, USB and PCI device enumeration, power and battery details, and many other categories.
No. The application is a single portable executable that runs without installation, leaves no registry entries, and can be carried on a USB stick between machines. For full access to low-level hardware data, running with administrator privileges is recommended.
The application reads data from a wide range of hardware monitoring chips including Super I/O sensors on motherboards, CPU package sensors, GPU sensors, and storage device temperature reporting. The breadth of recognized monitoring chips is one of the application's distinguishing strengths.
Yes. The complete system read-out can be saved to a text file with one click, and command-line mode supports scripted automation for fleet-level documentation across many machines.
No. The application is strictly read-only by design. It gathers information without writing any changes to the system, which makes it safe to run on production systems, servers, and any machine where altering configuration would be inappropriate.
Yes. The application receives regular updates that add support for current CPU generations, chipsets, sensor chips, NVMe drives, and other modern hardware. Recent AMD and Intel processor families along with DDR5 memory and PCIe 5.0 devices all show their full detail.
For laptops and other battery-powered systems, the power panel reports per-cell voltages where available, current charge and discharge rates, accumulated charge cycles, original design capacity versus current actual capacity, and detailed wear estimates that help determine whether a battery is reaching end of life.