

FurMark
About FurMark
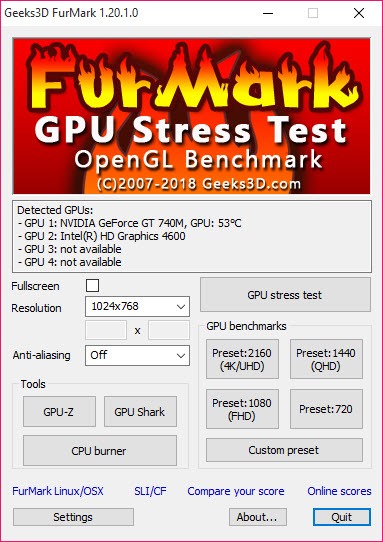
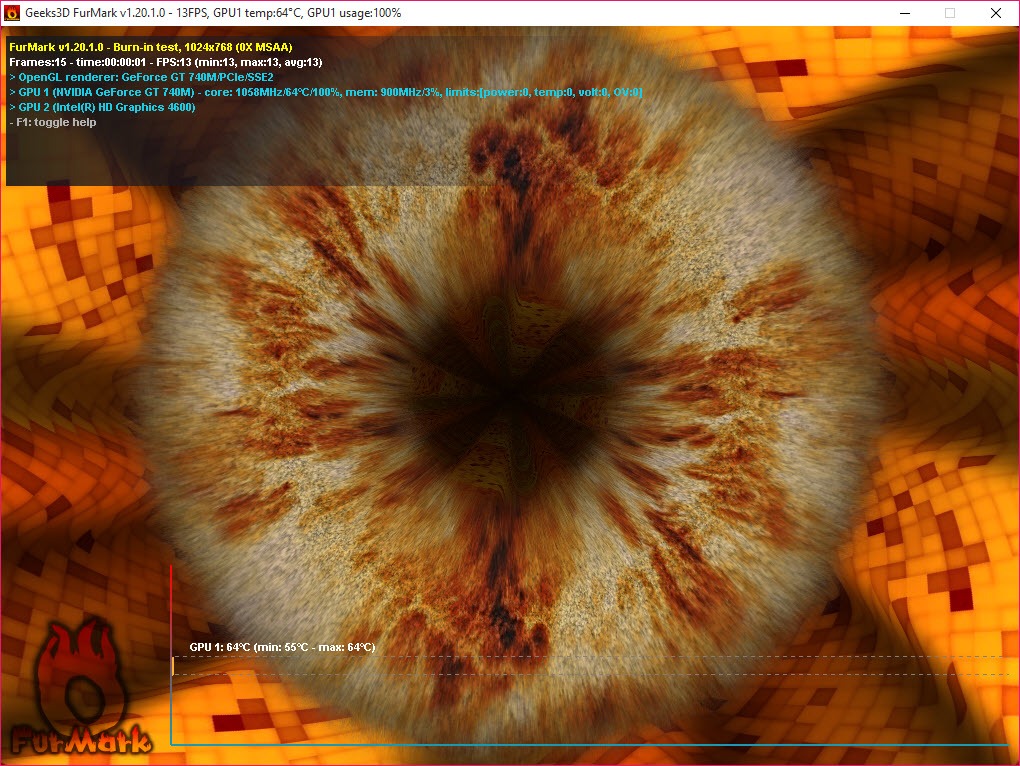
FurMark is the graphics card stress test people mean when they say “run the donut”. It renders a fur-covered torus with an algorithm chosen specifically because it pushes a GPU harder than almost any game will, drives power and temperature to their ceiling within minutes, and shows you live what the card, its cooler and its power delivery do under that pressure. It doubles as a benchmark with fixed presets, which makes comparing scores with other owners straightforward.
That bluntness is the point. A game loads a card unevenly, with peaks and lulls as scenes change. This tool pins it at maximum and holds it there, so whatever is marginal about your setup (a clogged heatsink, a tired thermal paste, an overclock that is almost stable, a power supply on the edge) shows itself quickly instead of crashing your evening three hours into a match.
The furry donut and why it is so brutal
Fur rendering means layer after layer of semi-transparent shells, each drawn and shaded, which keeps every shader unit busy and memory traffic heavy at the same time. In FurMark that workload produces a heat curve that climbs fast and then flattens at the point where the cooler can no longer keep up, and that plateau is the single most honest number you can learn about your card’s thermal design.
Both OpenGL and Vulkan renderers are available, alongside alternative scenes like a knot demo and a tessellation test, so you can confirm that a problem is the hardware rather than one graphics driver path.
Anti-aliasing, resolution, fullscreen versus windowed, and compressed textures can all be changed, and a VRAM option allocates a chosen number of gigabytes for the test, which turns the burn into a memory workout as well.
Stress test or benchmark, decided up front
The interface splits the two jobs cleanly. Run the stress test and it continues until you stop it or a time limit you set expires. Choose a benchmark preset instead (1080p, 1440p or 2160p) and the test runs a fixed duration and reports a score, which you can compare against public charts for the same card.
Scores here measure something narrow, raw sustained shading throughput, and they predict game performance poorly. For gaming comparisons, 3DMark reflects real engines far better. Where the presets shine is consistency, because a score that drops ten percent after a few months tells you thermal throttling has crept in long before you would notice it in play.
Sensors on screen while the card cooks
Live monitoring in FurMark overlays temperature, including the hotspot reading on supported cards, plus GPU load, core and memory clocks, fan speed and board power, all while the test runs. Everything can be logged to a CSV file, so a half-hour run becomes a chart you can study afterwards rather than numbers you tried to memorise.
That log is where the real diagnosis happens. A core clock that steps down while temperature hovers at one fixed value means thermal throttling. A clock that drops while temperature is moderate points at the power limit instead.
Seeing which wall the card hits tells you whether to clean the cooler or adjust the power target in MSI Afterburner, and the bundled GPU information utilities fill in the full hardware picture on demand.
The artifact scanner catches what your eyes miss
An overclock that does not crash can still be wrong. A memory error often produces a few miscoloured pixels for a single frame, invisible at sixty frames per second, and those are the early warnings of an overclock that will eventually corrupt something. FurMark includes an artifact scanner that inspects rendered frames for such errors at an interval you set, and counts them.
This is the feature that makes it useful for tuning rather than just torture. Raise the memory clock, run with the scanner on, and the first non-zero error count tells you exactly where the ceiling is, far earlier than a crash would.
Treat any artifact as a failure, back off a step, and test again.
How long to run it, and what to watch
The practical question everyone asks has a practical answer. Ten to fifteen minutes is enough for temperature to plateau and reveal the cooler’s verdict. Thirty minutes to an hour validates an overclock or a new build. Running for many hours adds little information, because this load is a worst case, not a daily one.
Keep an eye on the sensor readout throughout, and stop immediately if temperatures climb past the range you would accept in normal use or the fan behaviour turns erratic. The test is designed to find weaknesses, and a weak card is exactly the one you do not want to keep pushing once it has given its answer. Also expect a hot room and a loud case. That is the test working, not a malfunction.
Command line for repeatable runs
Every FurMark option is also exposed as a command-line switch, which suits technicians and reviewers who need identical runs on many machines. A single line can launch a specific demo at a set resolution, enable the artifact scanner, cap the duration in seconds or frames, log sensors to CSV, and exit with a benchmark result, ready to be wrapped in a batch file.
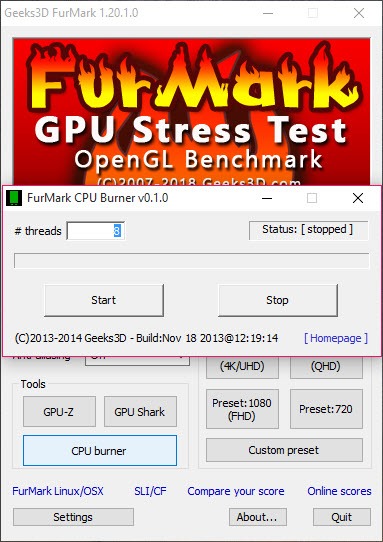
There is also a companion CPU burner for loading the processor at the same time, which turns a graphics test into a full-system power and cooling check. That is precisely the scenario that exposes a weak power supply, since the card and the processor both draw maximum current at once.
For dedicated processor stability, a classic CPU torture test remains the stricter tool.
Conclusion
FurMark belongs in the toolkit of anyone who builds, overclocks, repairs or buys used graphics cards. It answers the cooling question in fifteen minutes, catches unstable memory with the artifact scanner, and logs everything needed to understand why a card behaves the way it does.
Treat it as a stethoscope rather than a scoreboard. Its benchmark numbers flatter no game and its load is harsher than any real workload, so the right use is short, watched, deliberate sessions with a clear question in mind. Used that way, few utilities tell you as much about a graphics card in as little time.
Pros & Cons
- Pushes a GPU to its power and thermal ceiling faster than games or most benchmarks
- Live temperature and hotspot readings, plus clocks and board power, during the run
- Artifact scanner detects memory errors invisible to the eye
- Fixed 1080p, 1440p and 2160p presets give comparable scores
- OpenGL and Vulkan renderers help separate hardware faults from driver issues
- Full command-line control with CSV logging for repeatable tests
- Scores track raw shading throughput and say little about game performance
- The extreme load is unrealistic, so a card that throttles here may be fine in games
- Some drivers detect the test and limit power, muddying the results
- Heat and fan noise during long runs are considerable
Frequently asked questions
Ten to fifteen minutes shows where temperatures settle. Thirty minutes to an hour is sensible for validating an overclock or a new build, and much longer adds little information.
It depends on the card, but a reading that climbs well beyond what you see in demanding games, or a hotspot far above the core reading, signals a cooling problem worth investigating. Stop the test if numbers keep rising instead of levelling off.
Yes, especially with the artifact scanner enabled. A stable overclock runs without crashes and with zero detected artifacts, while any error count means the clocks should come down a step.
Either the card reached its temperature limit or its power limit. The sensor log tells you which, since thermal throttling coincides with a fixed peak temperature while power throttling happens at moderate temperatures.
Yes, through the companion CPU burner launched alongside the GPU test, which together check whether the power supply and case cooling cope with the whole system at full load.


