Core Temp


 (8 votes, average: 3.88 out of 5)
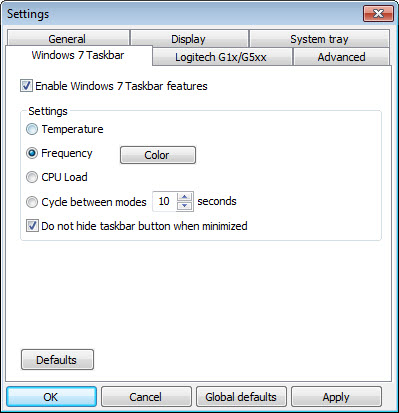
About Core Temp
Anyone who has worried about whether their CPU is running too hot has probably searched for a way to actually see those temperatures, only to discover that Windows itself doesn’t expose this information through any standard interface. There’s no Task Manager tab showing CPU temperatures, no Settings page where you can check whether your processor is overheating, and no built-in alert when things start running dangerously hot.
Core Temp is the small, focused utility that fills this gap, providing real-time temperature monitoring directly from the digital thermal sensors built into modern processors.
Developed by Arthur Liberman (alcpu) and refined over many years, this software has become one of the most widely recognized CPU temperature monitors available. The interface stays simple, the resource footprint is essentially nothing, and the information it shows comes directly from the CPU itself rather than through estimated readings or motherboard sensors that often disagree about what’s actually happening inside the processor.
Direct readings from the CPU itself
The defining strength of Core Temp is that it reads temperatures directly from the Digital Thermal Sensors embedded in each individual core of the processor. This is fundamentally different from how some monitoring tools work, which rely on motherboard-level sensors that report only an aggregate temperature from somewhere near the CPU socket rather than from the actual CPU silicon.
The practical difference matters. Per-core readings reveal which specific cores are running hottest, identify thermal imbalances that might indicate cooling problems, and provide accurate data even when motherboard sensors fail or report incorrect values. For users troubleshooting cooling issues or verifying that their CPU is operating within safe parameters, this direct sensor approach delivers the kind of information you can actually trust.
The application supports processors from both Intel and AMD across virtually all modern generations, with appropriate handling of the architectural differences in how each vendor exposes temperature data.
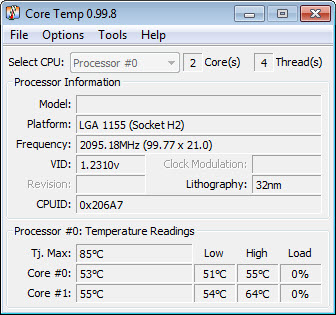
Real-time per-core temperature display
The main window shows current temperatures for each individual core in the CPU, updated in real time as the system runs. Beyond the current values, it also displays the minimum and maximum temperatures recorded since the application started, which is particularly useful for stress testing, gaming sessions, or any scenario where you want to know how hot the CPU actually got under sustained load.
Additional information includes the current CPU frequency, load percentage, voltage, and the TJ. Max value (the temperature at which the CPU starts thermal throttling). Seeing your current temperature alongside the throttle threshold gives you immediate context about how close you are to performance-limiting heat levels.
For users who simply want to know whether their CPU is running hot, this immediate visibility answers the question at a glance without requiring interpretation of obscure values or comparison against tables of acceptable ranges.
Configurable overheating alerts
A particularly useful feature is the configurable overheat protection system. You can set a temperature threshold that triggers warnings when reached, with options ranging from simple notification messages to more aggressive responses like running a custom command, putting the computer to sleep, or shutting it down entirely.
For users running extended workloads where they’re not actively monitoring the system, this protection feature provides genuine peace of mind. If the cooling fails or the CPU starts overheating for any reason while you’re away from the keyboard, the system can take action automatically rather than allowing potentially damaging temperatures to persist.
The threshold can be set conservatively to provide early warnings, or more aggressively to only trigger in genuinely dangerous situations. For most users, setting it 5-10 degrees below the TJ. Max value provides a useful balance between catching problems early and avoiding nuisance alerts during normal heavy use.
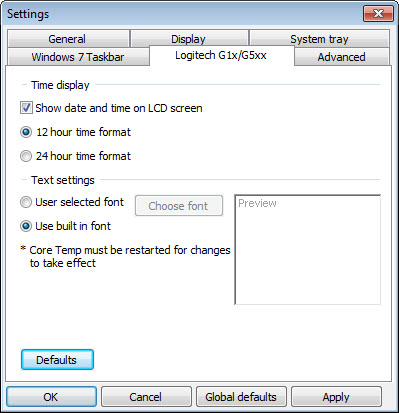
Plugins extend the core functionality
The base application provides solid temperature monitoring, but a small ecosystem of plugins extends its capabilities for users who want more. Some plugins integrate temperature data with the Windows taskbar more thoroughly, others log temperatures to files for later analysis, and a few add remote monitoring capabilities for users who want to watch temperatures from another device.
The plugin architecture keeps the base application small and focused while letting users add specific features they need. For most users, the default functionality is sufficient, but the extensibility is appreciated by power users who want their monitoring tool to do more than the basics.
Logging for sustained monitoring sessions
For users who want to track temperature behavior over time, the application includes logging functionality that records readings to a file at configurable intervals. This is invaluable for stress testing, where you want to see how temperatures behaved across an hour-long benchmark, or for diagnosing intermittent thermal issues that don’t happen during the brief periods when you’re actively watching the temperature display.
The logged data can be opened in spreadsheet applications for analysis, charting, or comparison between different cooling configurations. For enthusiasts experimenting with cooling solutions, fan curves, or thermal paste replacements, this longitudinal data provides the kind of evidence that subjective impressions can’t.
Notification area display
A small but appreciated detail is the ability to display the current core temperatures directly in the Windows notification area (system tray) as small numerical indicators. This puts temperature information at a glance without requiring you to open the main application window, which is genuinely useful for users who want passive awareness of CPU temperature throughout the day.
You can configure which information appears, how it’s color-coded, and at what threshold the display changes appearance. For users running temperature-sensitive workloads, this passive monitoring keeps you aware without constantly switching focus to a separate monitoring window.
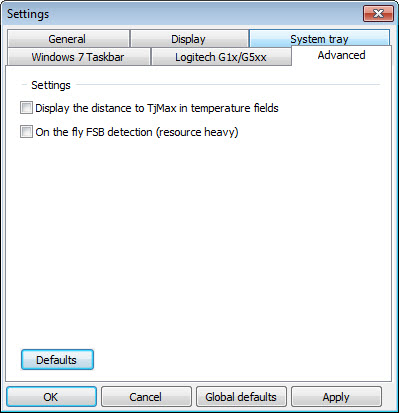
Useful context about your specific CPU
Beyond just showing current temperatures, the application also displays information about your specific CPU model, including the codename, manufacturing process, supported instructions, and various other technical details. While not strictly necessary for temperature monitoring, this contextual information helps users understand what they’re actually working with and provides reference data when troubleshooting or comparing systems.
For users assembling new PCs, helping friends with hardware questions, or simply curious about their own machine, having this CPU information readily available avoids needing to dig through other tools to find the same details.
Conclusion
Core Temp has earned its place as one of the standard tools for anyone who cares about CPU temperatures, offering accurate per-core monitoring with the kind of focused simplicity that makes it useful for everyone from casual users wondering about their thermals to enthusiasts running detailed thermal experiments. The combination of accurate sensor data, configurable alerts, and minimal resource footprint hits exactly the right balance for a monitoring utility.
It’s not the only tool in this category, and dedicated alternatives like HWiNFO offer more comprehensive system monitoring beyond just CPU temperatures.
But for the specific job of knowing what your CPU is doing thermally at any given moment, Core Temp delivers exactly what users need, in a form that respects their time and system resources.
Pros & Cons
- Direct readings from CPU thermal sensors provide accurate per-core temperature data
- Supports both Intel and AMD processors across virtually all modern generations
- Configurable overheating alerts can trigger automatic protection actions
- Logging functionality enables sustained monitoring and later analysis
- Notification area display offers passive temperature awareness
- Plugin ecosystem extends functionality for users who want more capability
- Minimal resource footprint barely affects system performance during monitoring
- Detailed CPU information serves as a quick reference for technical details
- Default interface looks utilitarian compared to more polished modern alternatives
- Some advanced features assume technical familiarity with CPU thermal concepts
- Bundled installer historically offered optional third-party software during setup
- Limited GPU monitoring requires combining with other tools for complete coverage
- Documentation could be more thorough for newer users learning what readings mean
Frequently asked questions
Most modern CPUs start thermal throttling somewhere between 95°C and 100°C, with the exact threshold (TJ. Max) varying by model and visible directly in this software. Sustained operation above 85°C indicates cooling issues worth addressing, while temperatures around 70-80°C under heavy load are typical and safe for most processors. Idle temperatures should generally be in the 30-50°C range depending on ambient conditions.
This software reads directly from the CPU's integrated thermal sensors, which are generally considered more accurate than motherboard CPU temperature sensors. The motherboard typically reports a temperature from a sensor near the CPU socket rather than from the CPU itself, which can disagree with actual CPU temperatures by several degrees in either direction.
Yes, by showing real-time temperatures during various workloads, this software makes cooling problems immediately visible. Idle temperatures that are higher than expected, sudden temperature spikes, or large differences between cores can all indicate cooling issues like dried thermal paste, blocked airflow, or failing fans.
Yes, the overheat protection feature can trigger automatic actions when temperatures exceed configured thresholds, including sleeping or shutting down the system. While modern CPUs have their own thermal protection that prevents actual damage, this feature provides earlier intervention and notification before throttling begins.
Yes, this software supports virtually all modern Intel and AMD processors, with appropriate handling of the architectural differences in how each vendor reports temperature data. The accuracy and feature support are equivalent across both platforms.
TJ. Max (junction temperature maximum) is the temperature at which the CPU starts thermal throttling to protect itself from damage. The application shows your specific CPU's TJ. Max value, which serves as a useful reference point for understanding how close current temperatures are to the throttle threshold. For most modern CPUs, this value falls between 95°C and 110°C.
This software is specifically designed for CPU monitoring and doesn't track GPU temperatures. For graphics card monitoring, dedicated tools like MSI Afterburner or HWiNFO are more appropriate, since they provide the GPU-specific data and controls that complement CPU monitoring.
Yes, the application can be configured to start minimized to the notification area, where it continues monitoring without keeping a window open. The notification area indicators provide ongoing awareness while the main window can be opened when you want detailed information.
The performance impact is essentially negligible. This software polls CPU thermal sensors at low frequency, which uses a tiny fraction of CPU resources and no meaningful amount of memory. You can leave it running constantly without any practical effect on system performance during normal use.